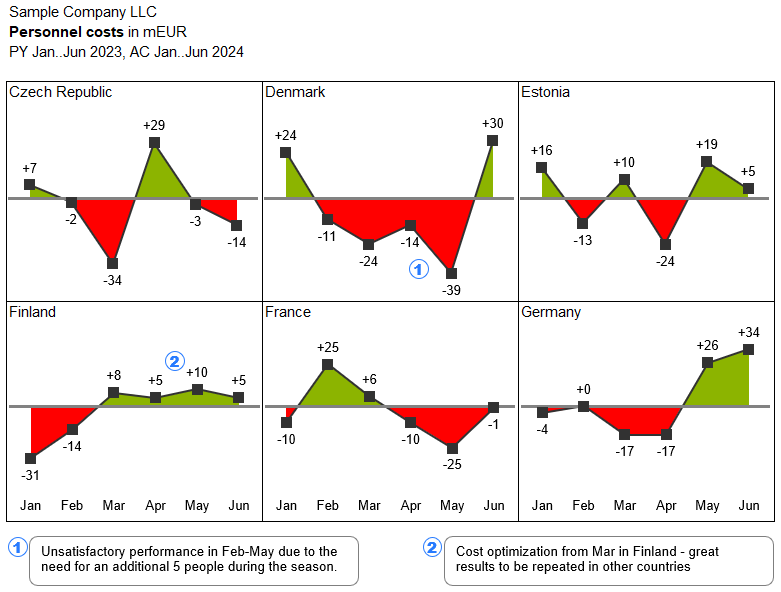
When delivering a dashboard to leadership or clients, your goal isn’t just to show numbers — it’s to tell a story, convey a message. With commentaries, you can guide viewers through key findings, comparisons, or calls to action, using visual pointers, highlighted text or similar methods.
Whether it's calling out “Record-high revenue” or “Cost spike due to external vendor,” you control the narrative. Specific comments make your dashboards more engaging and ensure your audience stays focused on what matters most.
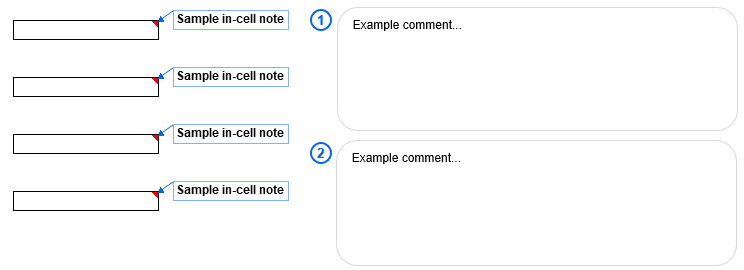
Financial reports often include data that’s pending confirmation or might include temporary placeholders. With custom annotations, you can flag these directly in the table — using clear labels like “Pending Reconciliation” or “Forecasted Value.”
This helps ensure readers understand the limitations of the data at a glance, without cluttering the layout. Instead of lengthy footnotes, you create focused, in-context notes that travel with the data, minimizing misinterpretation and unnecessary follow-ups.
You're presenting a quarterly report, and one KPI shows a significant drop. Without context, this might cause confusion — or even alarm. With comments, you can add a clear note explaining that the drop was due to a known one-time event (e.g., system downtime or a policy change).
By adding the commentary directly on the chart, you ensure executives interpret the data correctly without having to refer to another document. It makes your reporting more transparent and proactive, especially in high-stakes environments.
You have just signed for your free 14-day trial of XLBuddy! We're excited for you to discover how you can supercharge your spreadsheets and save hours of work.
We've just sent an email with your personal license key and simple installation instructions to the address you provided. It should arrive in your inbox within the next 5 minutes.
To ensure you get started smoothly, please keep the following in mind:
Check your Inbox: Look for an email from [email protected] with the XLBuddy in the subject line.
Look in your Spam folder: If you don't see the email in your primary inbox, please take a moment to check your spam, junk, or promotions folder. Sometimes, our trial request emails get mistakenly filtered.
One Trial per user: Please note that to ensure a fair trial for everyone, our system is set up to create only one trial license per email address. If your email has been registered for a trial in the last year, a new key will not be generated or sent. If you used other mail than previously, you will not be able to activate the second trial either.
Having trouble?
If your email hasn't arrived after 15 minutes and you're certain this is your first time signing up, please don't hesitate to contact our support team at [email protected]. We'll be happy to get you sorted out right away.