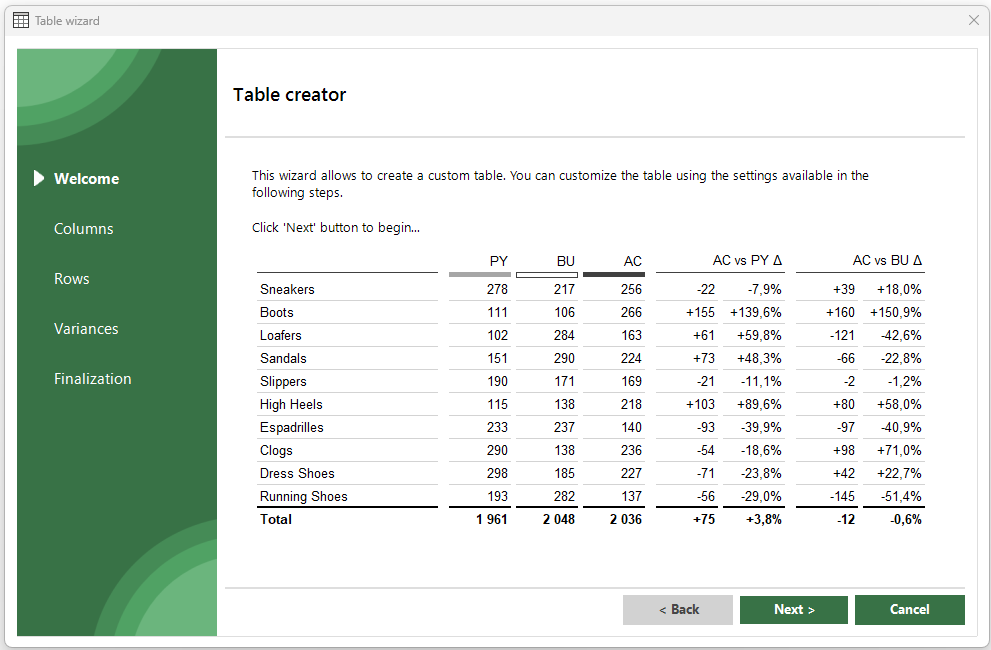
In fast-paced corporate environments, managers are often asked to pull together reports at the last minute — for unexpected meetings, performance reviews, or strategic updates. Without a tool like XLBuddy's table creator, this typically means scrambling to copy and paste numbers into Excel, manually adjusting fonts, borders, and column widths just to make the data readable.
The result?
With our table creator, users can create presentation-ready, consistently formatted tables in just a few clicks. The wizard takes care of layout, spacing, and alignment, ensuring that the final product looks polished and adheres to internal standards — even if it was created in minutes. This allows decision-makers to focus on interpreting data rather than deciphering it. The focus and work is put on numbers and the message, meaning, not the manual tweaks and playing with Excel quirks.
Whether it is for a surprise CFO briefing or a last-minute board deck, XLBuddy's table creator delivers structure and speed.
Real-world reporting is not one-size-fits-all. Some reports need compact summary tables; others require multi-level sections, groupings, or specific color schemes to align with internal KPIs or audience expectations. Traditionally, creating such specialized tables means either building them from scratch every time or painfully editing older files — increasing the chance of inconsistency or mistakes. Not even mentioning the time wasted to do this.
Our table creator solves this by allowing users to customize everything from row and header formatting to cell styles and adding variance columns — all within a guided, user-friendly interface. You can create tables for different business contexts, ensuring flexibility without sacrificing standardization. Teams can quickly adapt to new reporting demands while staying aligned with visual and structural best practices. It is a power without complexity.
In large organizations, different departments often prepare their own reports — finance, HR, sales, operations — each with their own interpretation of what a “good table” looks like (oh gosh, here we go!). This leads to a lack of cohesion when merging reports or presenting to executives. Misaligned formats, inconsistent labeling, and varied visual priorities make comparisons harder and reduce overall trust in the data.
XLBuddy eliminates these discrepancies by ensuring every team member, regardless of skill level or department, uses the same structured approach. With centralized settings and guided formatting, tables created in marketing may look the same as those from finance — clean, IBCS compliant, and comparable. This not only saves time during creation but also reinforces a unified reporting culture across the organization. Everyone speaks the same visual language, making collaboration seamless and results more impactful.
It also save tremendous amount of time, that is wasted on analyzing 10 different styles of tables in sometimes one meeting.
You have just signed for your free 14-day trial of XLBuddy! We're excited for you to discover how you can supercharge your spreadsheets and save hours of work.
We've just sent an email with your personal license key and simple installation instructions to the address you provided. It should arrive in your inbox within the next 5 minutes.
To ensure you get started smoothly, please keep the following in mind:
Check your Inbox: Look for an email from [email protected] with the XLBuddy in the subject line.
Look in your Spam folder: If you don't see the email in your primary inbox, please take a moment to check your spam, junk, or promotions folder. Sometimes, our trial request emails get mistakenly filtered.
One Trial per user: Please note that to ensure a fair trial for everyone, our system is set up to create only one trial license per email address. If your email has been registered for a trial in the last year, a new key will not be generated or sent. If you used other mail than previously, you will not be able to activate the second trial either.
Having trouble?
If your email hasn't arrived after 15 minutes and you're certain this is your first time signing up, please don't hesitate to contact our support team at [email protected]. We'll be happy to get you sorted out right away.